


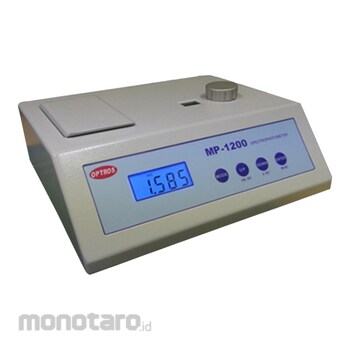
SEIKOHSYA Smart Spectrophotometer
#Grup produk P108247914
Spesifikasi
| Interface | PC-USB |
|---|---|
| Measurement Range | Absorbance/-0.301 to + 3.000 , Transmittance/0.0 to 200.0 T % , Concentration/0.000 to 2000 C (Calibration Curve 3 Type Selection) (mg/dl, mg/l, g/l, ppm, M) |
| View (mm) | 65x26 4 1/2 LCD |
| Power Supply | AC100 to 220 V 50 to 60Hz (± 10%) |
| Detector | High sensitivity silicon photocell |
| Stray Light | ≤ 1.0% |
| Accessories | Instruction Manual, power cord, dust-proof Cover Light Shielding Cap, Glass Square Cellx2, Fuse 1A |
| Diffraction Grating (mm) | 1200 |
| Dimensions L x W x H (mm) | 320x290x120 |
| Fuse | 0.0416666666666667 |
| Item Code | 32 -5000 |
| Light Source | High-intensity halogen lamp (6 V, 10 W) |
| Photometric Accuracy (T%) | ± 2 |
| Power (W) | 25 |
| Spectroscope | Greeting (1200 Pieces/mm) |
| Transmission Repeatability (T) | ≤ 0.5% |
| Wavelength Accuracy (nm) | ± 2 |
| Wavelength Reproducibility (nm) | ≤ 1.0 |
| Wavelength Setting Range (nm) | 340 to 1000 |
| Wavelength Width (nm) | 6 |
Pilih jenis produk yang diinginkan
| Nomor SKU | Model Number | Masa Persiapan Barang | Harga | Jumlah |
|---|---|---|---|---|
| Loading... | ||||
Informasi Produk
Warning
Image on this page only as Representative Image, Please check the specifications of each model number for details.Feature
The cell used for measurement can be a standard square cell or a normal test tube (outer diameter φ 12/16 .5 ~ 18 mm).
Large LCD backlight display for easy viewing The optional software allows high-precision measurement of non-linear sample densities when connected to a PC.
Density calibration curve, measurement data can be stored and edited.
The measurement items are absorbance ABS, transmittance% T, concentration CONC factor value input, real-time graphing by the control Kinetech measurement from the PC side, and each measurement value can be displayed, stored and edited.
Calibration curves for concentration values are selected from three types: Piecewise polyline, Linear transient regression (C = a + bA), and Quadratic quadratic regression (C = a + bA + cA2).
Calibration curves are automatically generated for non-linear samples and displayed on a graph.
The calibration curve can be memorized, so you can recall the item you want to measure next time, and immediately measure, display, and edit the sample density value.
Each saved data can be converted to text or Excel format for editing and saving.
Ulasan Produk

Tidak ada ulasan
